
What do we do when the data you have has a missing values? There are very few options like:
1. Delete the data
2. Make the missing value zero
3. Approximate
4. Ignore and so on
Now obviously, options 2 and 4 are not the likely way of dealing with the missing data.
When we make the missing value ZERO, you are unknowingly creating a new data which may be either valid or not. For example, what if the ZERO value is one of the likely possible value of the variable that you are dealing with? In that case we have a wrong set of pattern.
Further, we simply cannot ignore the data. Ignoring is some how similar to deleting.
When we delete the data, we are decreasing our sample number, hence decreasing the power of our statistical tools. As we know, the statistics work best when there are large number of data. In addition, there are other difficulties with deleting a data, which we will get to latter on.
Therefore, it seems very probable that we approximate the value. But we have to be very careful while doing so. This time, we will be looking at a simple algorithm to approximate certain typical set of data. There are commercial software available for the purpose like SPPS, SAS etc. To note, you can use any programming software to approximate. I have used java to read the data from excel and then approximate the value. Its your choice.
Let me first give a very simple algorithm to approximate:
1. Read the whole data in an array
2. Move along the array and find a missing value
3. When you find, take a difference between the values of the consecutive data over certain range
4. Take an average of the difference
5. Add that average to the data next to the missing value
6. The new value is the approximated value
7. Repeat the process for all the missing values
In mathematical terms:

where,
d = data array
n +1 = location of the missing data
N = total number of difference taken
Now, in these variables we can play around to get the required approximated value. These variables control the trend of the approximation.
When you are approximating, make sure to plot the data to look how your approximation has turned out. This will give you better control of your result. The reason for doing this is that no two data sets have the similar trend, therefore particular algorithm may work for one but not for other.
Lets take some examples and see where there is places for errors and wrong approximation.

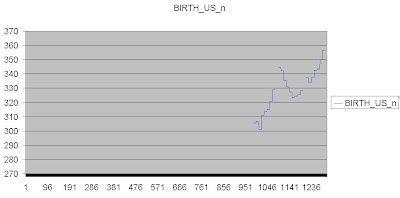
In this approximation, everything went very well. The data from 1 to 928 was missing. The trend looks very simple - the values are rising and not decreasing. Therefore, the approximation worked very well. Try for other data you have and you may be satisfied with the result. But can we justify our approximation. What if the values initial were peaking and not around zero. Therefore make sure, your approximation is also logical. For that try to understand the nature of the variable that you are handling. This way the margin for error is reduced.
One very important thing to remember is that, make sure you are not trying to approximate missing values where the missing values make about 75 or 80 percent of your data set. This can really go very very wrong.
For example:
The above data looks very damaged. The trend is somehow unclear and missing values are almost above 70 percent of all. When we run the same algorithm for the above data we get the result as below:

What can we say about the above result. Very unlikely and unrealistic. Well the algorithm was the same but it did not turn out as we expected. In this case, we need more of an intelligent approximation that can look at the trend and decide how to approximate. May be some adaptive algorithm. But we can also argue, if we can really approximate the above data with complete satisfaction as the number of missing values are in large number.
Another example:
Data :
Result:

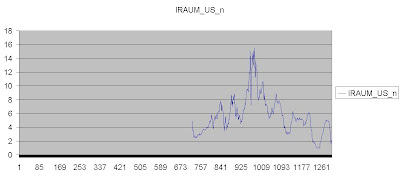
Wow!! How is that trend possible? You see, not always is the algorithm doing a job for us. Therefore, we have to be really very careful. In this case, our data was very unpredictable: we had many rise and fall. The algorithm samples only the consecutive data for predicting the next values, therefore we run into wrong prediction. From this we can say, the algorithm does not work with the random data. To clarify this point lets zoom into next data :


In the above graphs, we can clearly see that the data are fluctuating in a random manner. Remember the above graph represents the same data set, but in different level of zoom. In this case its virtually impossible to predict the missing value using the above algorithm. Therefore, we must come up with a better algorithm.
It think I have almost covered most of the fundamentals on missing values. So, if there is any suggestions or any observation on my analysis, please feel free to comment on it.
Comments
Post a Comment