When every variables are ready to be put into some software machines to be analysed, and the formula for the relations to be spit out, it is always tempting to believe that the answer is correct. But it isn't? We need human intelligence and analyses to come to the right result.
Similar things happen when you are making linear models through regressions. As, I have written earlier, the choice of variable is very important. So how do we insure that the resultant choices made are justified. It is always easy to come to result but harder to justify.
Lets look at some examples:

The above graph is the graph of a Revolving Value (Revolving Balance). This is the variable very important for the Bankers. Therefore, it will be interesting for them to know before hand the value of the Revolving Balance.
There are many variables to be included for the analysis and modeling. By following the rules and methods mentioned in my previous blogs, I have constructed an initial model. Using that model, I have predicted the values. lets look at it below.
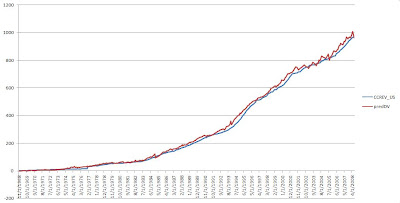
Remarkable!! The predicted lines, which is the red one, seems to follow the real line. But, this analysis in itself is insufficient to prove the validity of the model. We need to look at it sown the line further. Just for the case, the R-square Value for this model was around 0.98!

Graph of Error Versus the Revolving Value
Here, we are trying to look at the relationship of error and the real value. But why??
The error is by nature defined to be RANDOM and having zero correlation with any variable. Therefore, the error must not be predictable. In this figure, we see that the error is vibrating between the zero value with higher bias to the negative side. Hence, we have a line drawn to best fit the plots. Ideally, this line must pass through the zero line. The line seems to have deviated to -30 below. This must be reduced to have a better result. This analysis of error with time is necessary, as error are RANDOM.

Graph of Error Versus Time
This above graph is also almost the same as with the previous one, except the error is related to the real value. It seems the model was not able to predict the higher values with accuracy. Something must be done here. But What?? May be reduce the variables or validate the raw data to conform that there is no error in the data. Also, we can ignore this particular value.But BE CAREFUL, it might have a significance.
These kinds of analysis speaks about the model that you are building.
Just to show that there are many ways to analyses the error, I am posting another graph.
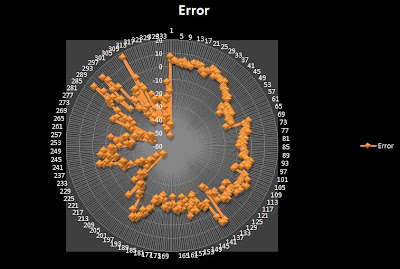
OK, don't worry about the figure. Actually its quite simple. The linear graph with the time has been folded to make the a circle.
In idealistic situation, the plot should be a perfect circle at Zero line. In good and realistic model, the figure must still be circle but with certain constant thickness. In this case it is neither.
Last thing, there is one important graph to check the randomness of your error and it is done by plotting the histogram of the error. The plot must match the Normal Distribution Curve.
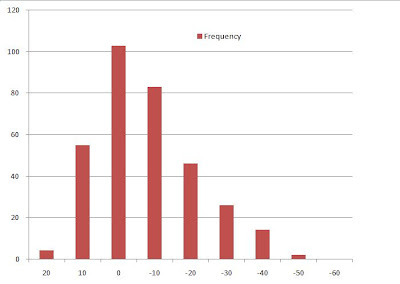
The curve above shows that the mean of the error is ZERO, which is good. But the biasness to the negative side has to be taken care of.
Therefore, in this way we can analyse the model being constructed and keep tinker until a better one is obtained.
Comments
Post a Comment