During the analysis of the variables and their relationship with the outcome variable, we can choose Bi variate or Multivariate. Both have their own advantages and disadvantages.
Bi variate considers the effect of a single variable on the outcome variable, thus ignoring the effect of the other. Depending upon the correlation factor the variables can be either chosen for further analysis or else rejected. But, rejecting a variable just on the bases of correlation factor is not so wise decision.
On the other hand, multivariate analysis checks the relationship between the outcome variable and all the other independent variables. From this type of analysis we get a more clear picture on how all the variables are affecting the outcome or dependent variables. The scenario in this case can be described as multi dimensional, cause there are more than 2/3 variables.
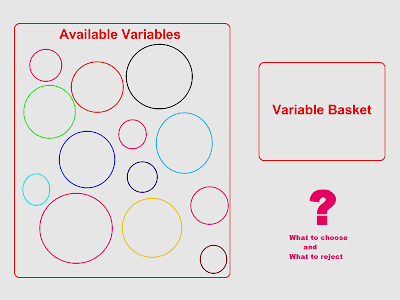
In the process of modeling, it becomes a very important for us to select the right variables so that the model can predict with high accuracy. In such case, running both the analysis step by step will reveal the more appropriate choices.
But, the choices must not be always made on the basis of the numerical values or percentages, sometime , it is be more wise to include a variable which may seem to have effect in the future or in the different conditions even though it may have low score.
Methods of choosing the variables
There are many statistical test available in order to choose the relevant variable. Few important ones are as follows:
1. Chi-squared
3. Information Value
1. Chi-squared
The above method gives the correlation between the predictive variables and the log of the odds of a bad outcome. This allows to measure the predictive power of the variable, meaning - how important can this variable be for building a predictive model for the outcome variable.
2. Spearman correlation
The above method gives the correlation between the ranking of the predictive variables and the outcome variables and not the real values of the variable. In this analysis, the relationship doesn't have to be linear, it just has to be proportional either in negative or positive sense.
3. Information Value
The Information Value is the most interesting statistical process because it measures the amount of information that a variable can give while designing model. It is measured in basis of the deviation of the values within the variables. It is based upon the Information Theory. The range of this score is 0-3.
Example :

The above is just an example of how the table might look. From the above table it is clear that the variable 1 has the highest information-value but less Chi-Squared than Variable 2 and negative correlation.
Whereas , the variable 3 has the least information and also the Chi-squared and Spearman Correlation, thus it can be removed from the analysis, UNLESS, you consider that it is of some value from the business perspective.
After the above process is carried out, the variables can be scored a new value depending upon these three scores. Further, a new ranking can be carried out for all the variables by taking this new score into account. This allows a new perspective for choosing a variable.
The whole process can be in form of iterative process because the result all depends upon the sampling algorithm that has been used. Different sample can give different results, thus the process can be lengthy and laborious.
Reducing Redundancy in variable
Why is it necessary to reduce redundancy in the variable? This has actually many reasons some of them are as follow :
- Over crowding the model with many variables with no purpose.
- Reduce the significance of the predicted co-efficient of the parameters.
- Risk of out fitting the model.
- Can destabilise the estimates.
- Also increase the computation time which can be crucial when the data is in millions.
How can we identify the redundancy?
In order to identify the redundancy, correlation must be carried out among the variables and not with the outcome variables. After that, the variables must be ranked according to their correlation factor. Then, among the clusters, one may be picked by reference to the three scores discussed above.
There are many commercial soft wares available for the above process. The one that comes to my mind is SAS. But other statistical software like MatLab can also carry out the operation with some programming module written to it.
Comments
Post a Comment