
What is Single Factor Analysis(SFA)? I really won't go into scientifically defining the terminology because it can get very complicated as the mathematical tools get varied. So I am going to say in very layman terms, what exactly does SFA mean and how do we carry on the analysis.
Then you vary Independent Variable and check the response on the Dependent Variables. The main objective is to prove or disprove that, the change in IV has effect on DV. Therefore, usually in SFA we go by having a hypothesis, that there is a relationship and may prove it wrong or right during analysis.
Example I
The concentration of the CO2 ( [Co2]) has an effect on the temperature of Earth[T].
The above statement is the hypothesis. It may sound old, as it is the proven fact. But it wasn't back in 1824. And the interesting fact is that the Global Warming was not identified by Environmentalist, but by a French mathematician Jean Baptiste Joseph Fourier because he was looking at the NUMBERS. An analyst on his own way.
So what do you do to prove that above is true? There is many hypothesis test available like T-test, Z-Test and so on. But all the test follows a similar method.
Our hypothesis is still incomplete. We have to say how the variable are related. So I say, the rise in [CO2] increases the [T]. Fair enough. After this we analyse the data on CO2 concentration and temperature value.
The reason for me to take this example is that it clearly associates the principle of Single Factor Analysis.
Example II
This time lets take a business problem. In Banking sector there are many variables being recorded every minute. For the following example, I have used USA economic data from www.freelunch.com.
Let me explain the variables first:

Disposable Personal Income is personal income less personal tax and non tax payments. It is the income available to persons for spending or saving.
Consumer Installment Credit Revolving is the credit taken from the bank by the consumer and revolving means that the value of the credit is not fixed and that the credit is also replenish able. Lets put this as simple as that.
Other variables are the mathematical function. Among them Standard Deviation is the mean of the all the variance from the mean value. Also I had choosen these variable as they had their correlation value of about 0.8539, which is fair value to suggest relationship.
So ready? Let look at the values and see what it says.
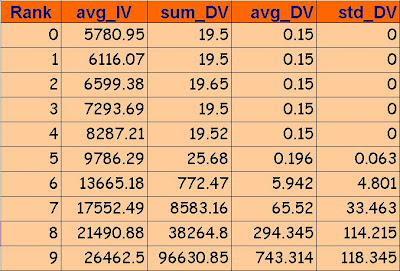
Do not be confused with the Rank variable, its the ways of categorising the variables. This is also one of the major step in the analysis process. It can be achieved by many complex clustering technique like K-means or by simple manual categorising. In this case the ranking has been done will respect to the magnitude of the variables, separating from small ones to larger ones.
So the data shows, rise in the value as we move from top to down. It is always better to plot the graph. The reason for me to take the sum, average and Standard deviation will be clear after wards. Remember there is no 'time' variable concerned here. We are only looking at two variables and the effect of one on another. The graph below shows the average values of the independent variable for each ranking. It says nothing about the relationship between DV and IV.

Graphical Analysis

Lets look at the 'sum value'. The result shows that the for smaller values of Rank, the sum is very less and as the rank value increases, the sum of DV also increases. From business point of view, as the people have more saving on their hand, they are willing to spend more. Fair enough.

The graph against the average value shows the similar analysis. The reason can be explained simply by realising that average value and the sum are related as average being the division of sum by the variable count.
So we have same analysis.

But what is this? The graph has different characteristics here. The rank starting from 0 to 6 has almost zero value and almost rise in 7 and 8 but not much from 8 to 9. This result has more things to tell than the above graphs of average and sum.
Let me tell, exactly what we did just now. We simply took the average value and applied a mathematical tools to give us a new variable that gave us a more better perspective on the variable. Such is the power of mathematical tools.
So lets analyse. The standard deviation gives us the variation in the Dependent variables for a change in Independent Variables of certain categories.
From Rank 0 to 6, we see no variation, indicating that when the value of IV is small the variation in it has no effect on the DV. Its fair enough, cause when people are less savings they are not willing to spend more so less use of Credit Card.
But with in, 6 and 7, the variance increases, indicating that when people have enough savings, small increses in their savings will largely affect their spending habbits. But in Rank 9, there is no change in the spending habbits. More savings would mean more spending. So people are more critical in their spending nature when their saving is in between 6 and 8 beacuse they are trying to balance their savings and spending during those time. This analysis is not possible by looking at the sum or average value.
The above analyses has really made it very clear about the relationship between Revolving Balance and Disposal Income. It not only told that they are directly related but also how they are related.
This is the SFA, also note that it was the standard deviation that gave us the proper understanding rather than sum and average. But this may not be the case, everytime. Also, we did not go by stating a hypothesis. Well, you may start by a hypothesis, but your statement is not going to change the method, any way is valid.
So what do you all make of it? Let me hear from all of you.
Comments
Post a Comment